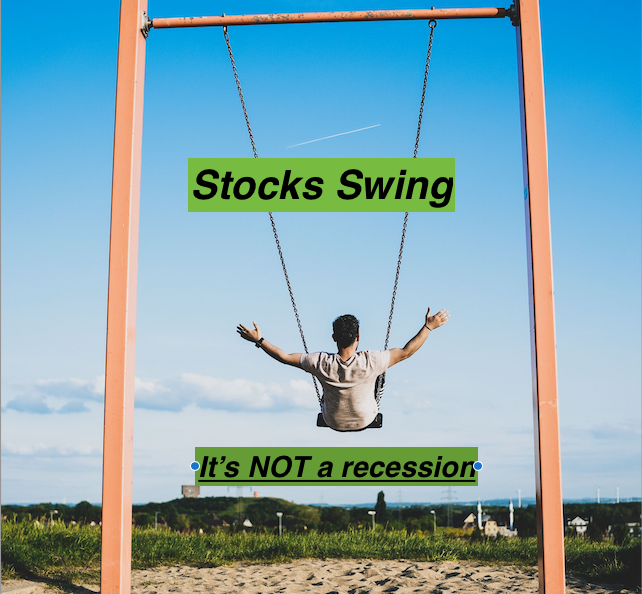
Large stocks can rise or fall by about 10% in a single day, yet the broader market often moves far less. That contrast may seem alarming. However, it can point to low recession fears rather than broad economic distress. The key is to study how stocks move together, not just how much one company moves.
Table of Contents
ToggleIndividual Stocks Are Acting Wild
Daily price swings of 10% are unusual for some of the largest companies on the market. Moves of that size are more common among small firms, speculative investments, or businesses facing major news.
Recent action in semiconductor and memory stocks has challenged that pattern. Some large companies in these industries have posted sharp gains or losses from one session to the next.
Those moves attract attention because large companies have deep analyst coverage and heavy trading volume. Their prices usually reflect many investors’ views. A sudden 10% move can therefore look like a warning about the entire market.
Yet the S&P 500 may barely move during the same session. That difference matters. It suggests investors are not always running away from stocks as a group. They may simply be moving money from one opportunity to another.
“It is not a normal market when the largest stocks in the world are up or down 10% every other day.”
As CEO of LifeGoal Wealth Advisors, a Certified Investment Management Analyst, and a Certified Financial Planner, I view this as a lesson in market behavior. A dramatic stock chart does not always describe the health of the full market.
View this post on Instagram
What Markets Often Do Before a Recession
Investors tend to behave differently when they fear an economic contraction. Concern spreads across industries because a recession can hurt employment, consumer spending, business investment, and corporate profits.
During such periods, company-specific details can lose some influence. Investors may sell many types of stocks at once. A business with strong results can fall behind a weaker competitor because both face the same economic risk.
Markets often display several traits when recession anxiety rises:
- Stocks across unrelated sectors begin moving in the same direction.
- Bad economic news can trigger broad selling.
- Less negative news may produce a market-wide rally.
- Daily moves in the S&P 500 often grow larger.
- The VIX may rise as traders pay more for protection.
This behavior is known as higher market correlation. In plain language, it means investments start acting more alike. Investors focus on the shared threat instead of asking which company has the best products, earnings, or valuation.
A falling tide then affects most boats. Defensive sectors may hold up better, but fewer areas escape the pressure. The broad index becomes more volatile because large groups of stocks are moving together.
Low Fear Can Produce More Stock Picking
A calmer economic outlook can create the opposite pattern. Investors may remain willing to own stocks while disagreeing about which companies offer the best potential return.
Instead of leaving the market, they rotate capital. Money can flow out of one technology company and into another. It can also move between industries, such as energy, financial services, health care, and consumer businesses.
This rotation can create severe movement below the index level. One group may fall sharply while another rises. Those changes offset each other inside a broad index, leaving the S&P 500 close to flat.
That is one possible explanation for the sharp action among semiconductor and memory companies. Investors may be adjusting expectations for demand, pricing, profit margins, capital spending, or competition. They are debating where future returns may be strongest.
The distinction is simple:
- Broad fear often causes investors to sell many stocks together.
- Competitive rotation causes investors to sell some stocks while buying others.
- A quiet index can hide major gains and losses among its members.
The second pattern may look chaotic on a list of individual stocks. At the index level, however, it can appear controlled. That is why isolated price swings should not be treated as direct proof of an approaching recession.
Why the VIX Adds Useful Context
The VIX is commonly called the market’s fear index. It uses S&P 500 options prices to estimate expected volatility over the next 30 days.
A high VIX often means investors expect larger moves in the broad market. It can also indicate increased demand for options used to limit losses. A low reading suggests expectations for index-level volatility remain contained.
Despite violent moves in selected stocks, the VIX has been subdued in the conditions described here. That sends a different message from the individual price charts.
“The market’s saying recession, not anytime soon.”
This does not mean the market can rule out a recession. Markets process incomplete information, and investor expectations can change quickly. Economic data, central bank policy, credit conditions, or an outside shock can alter the outlook.
Still, a quiet VIX combined with a relatively steady S&P 500 suggests investors are not pricing an immediate, market-wide crisis. They appear more focused on choosing winners and avoiding losers.
Index Calm Can Hide Serious Company Risk
Broad stability should not be confused with safety in every stock. A company can lose substantial value even if the economy remains healthy and the index stays calm.
Large price moves may reflect earnings results, lower guidance, product delays, regulation, management changes, or revised growth forecasts. High expectations can also make a stock sensitive to small disappointments.
This is especially relevant in sectors linked to rapid investment cycles. Semiconductor and memory businesses can experience sharp changes in supply, demand, and pricing. Investors may react quickly when new information challenges prior assumptions.
Concentration adds another issue. A portfolio built around a few popular companies may swing far more than the S&P 500. An investor can therefore suffer major losses during a calm period for the broad market.
I would separate two questions before making an investment decision. First, what does the market suggest about the economy? Second, what risks exist within the specific company or portfolio?
Those questions are related, but they are not identical. A low implied probability of recession does not guarantee strong results for every business.
How Investors Can Read These Signals
No single indicator should control an investment plan. The VIX offers useful information, but it reflects expectations, not certainty. Index performance also gives only a partial view because gains in a few large companies can offset weakness elsewhere.
A more informed review considers several signals together:
- Compare individual stock swings with broad index movements.
- Watch whether unrelated sectors rise and fall together.
- Review the VIX for changes in expected index volatility.
- Separate company news from wider economic developments.
- Check whether a portfolio depends too heavily on one stock or industry.
Long-term investors should also avoid treating every dramatic session as a call to trade. Large daily moves can create emotional pressure. Decisions made during that pressure may conflict with a sound financial plan.
Diversification cannot prevent losses, but it can reduce dependence on one company’s outcome. Position size also matters. A volatile stock may fit within a portfolio when its weight reflects the investor’s goals and ability to accept risk.
The market signal discussed here is subtle but useful. Wild action in major stocks does not automatically mean investors expect an economic collapse. If the broad index is steady, the VIX is quiet, and sectors are moving in different directions, capital may be rotating rather than retreating.
My practical conclusion is to look under the surface before reacting. Study whether fear is spreading across the market or staying focused on certain companies. That distinction can help investors interpret volatility with more discipline while keeping their plans tied to long-term goals.
Frequently Asked Questions
Q: Can sharp declines in major stocks predict a recession?
Not by themselves. A recession warning is stronger when many sectors fall together, broad indexes become more volatile, and market fear rises. A single company or industry may decline for reasons unrelated to the economy.
Q: Why can the S&P 500 stay flat while large stocks swing?
Broad indexes combine many companies. Gains in some holdings can offset losses in others. The index may show little movement even while individual stocks experience large price changes.
Q: Does a low VIX mean investors have nothing to worry about?
No. A low VIX suggests limited expected volatility for the S&P 500 over the near term. It does not remove company risk, guarantee future returns, or prevent economic expectations from changing.
Image Credit: Omar Ramadan; Pexels